signs
signs.RmdThe Basics
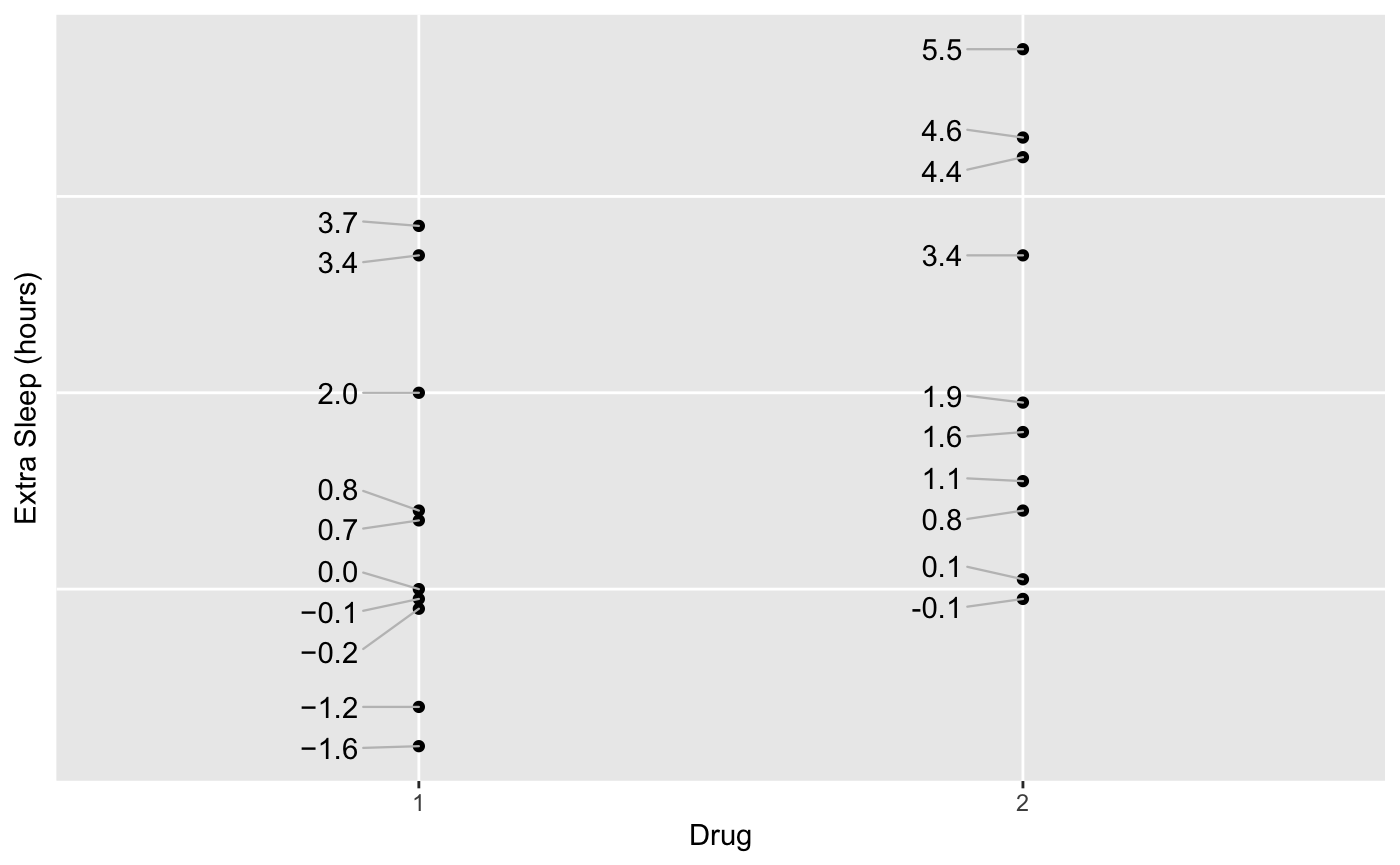
Using signs is simple, especially if you’re familiar with functions like number(), number_format(), comma(), comma_format(), percent(), and percent_format() from the scales package. It simply provides two new functions to complement these: signs() and signs_format().
- Points in group 1 are labeled with a true Unicode minus glyph.
- Points in group 2 are labeled with the traditional ASCII hyphen-minus.
- Basic usage is identical.
theme_set(theme_gray())
theme_update(
  panel.grid.minor = element_blank(),
  axis.text.y      = element_blank(),
  axis.ticks.y     = element_blank()
)

p <-
  ggplot(sleep) +
  aes(group, extra) +
  geom_point() +
  xlab("Drug") +
  ylab("Extra Sleep (hours)")

label_hours <- function(mapping) {
  geom_text_repel(
    mapping,
    nudge_x       = -.1,
    direction     = "y",
    segment.size  = .4,
    segment.color = "grey75",
    hjust         = "right"
  )
}

p +
  label_hours(
    aes(
      label = case_when(
        group == 1 ~ signs(extra, accuracy = .1),
        group == 2 ~ number(extra, accuracy = .1)
      )
    )
  )
Other Number Formats
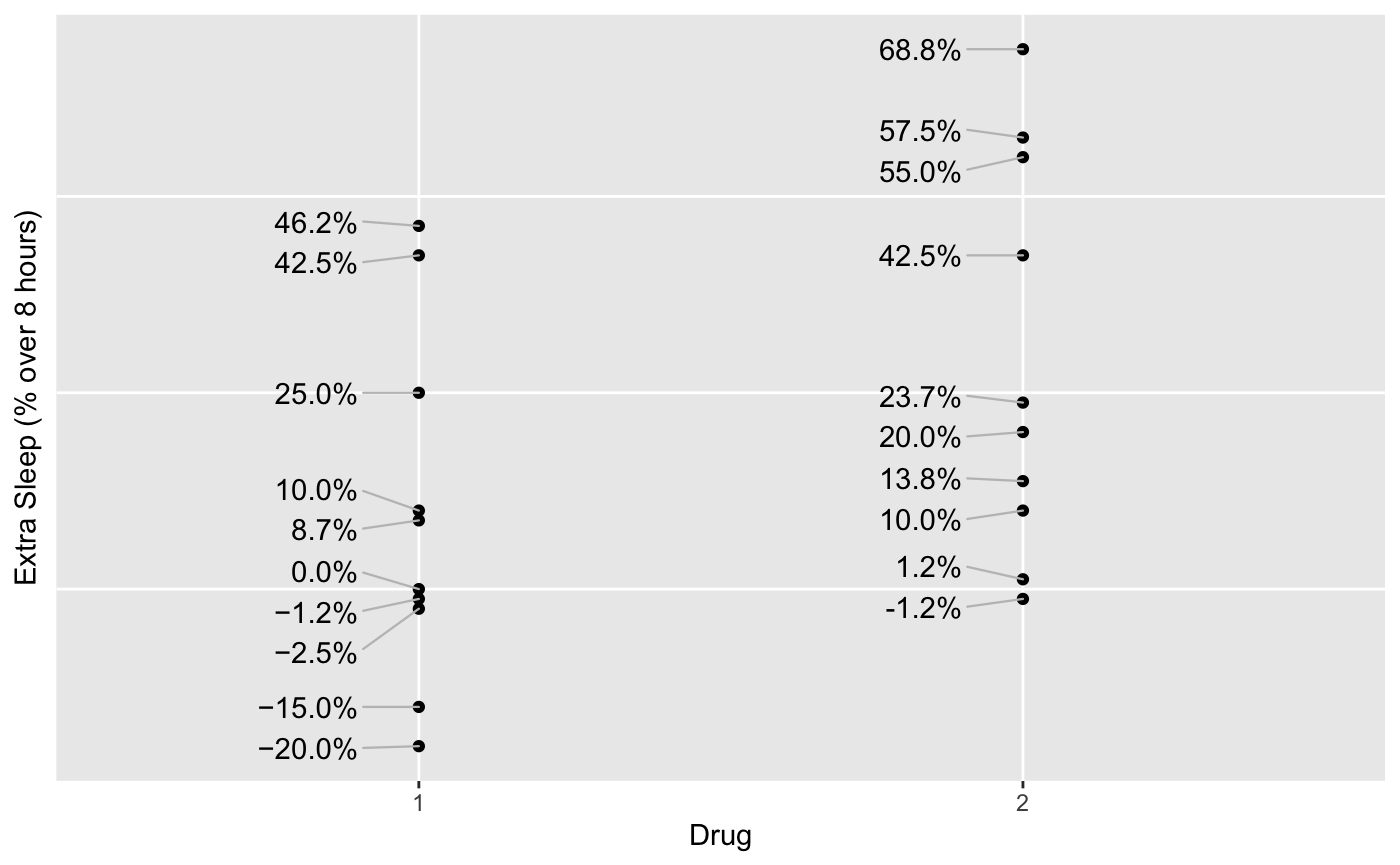
You can use any formatting function with signs::signs()—not just scales::number(). Let’s assume everyone gets 8 hours of sleep, so we can label the points as percentages.
p +
  ylab("Extra Sleep (% over 8 hours)") +
  label_hours(
    aes(
      label = case_when(
        group == 1 ~ signs(extra / 8, accuracy = .1, format = scales::percent),
        group == 2 ~ percent(extra / 8, accuracy = .1)
      )
    )
  )
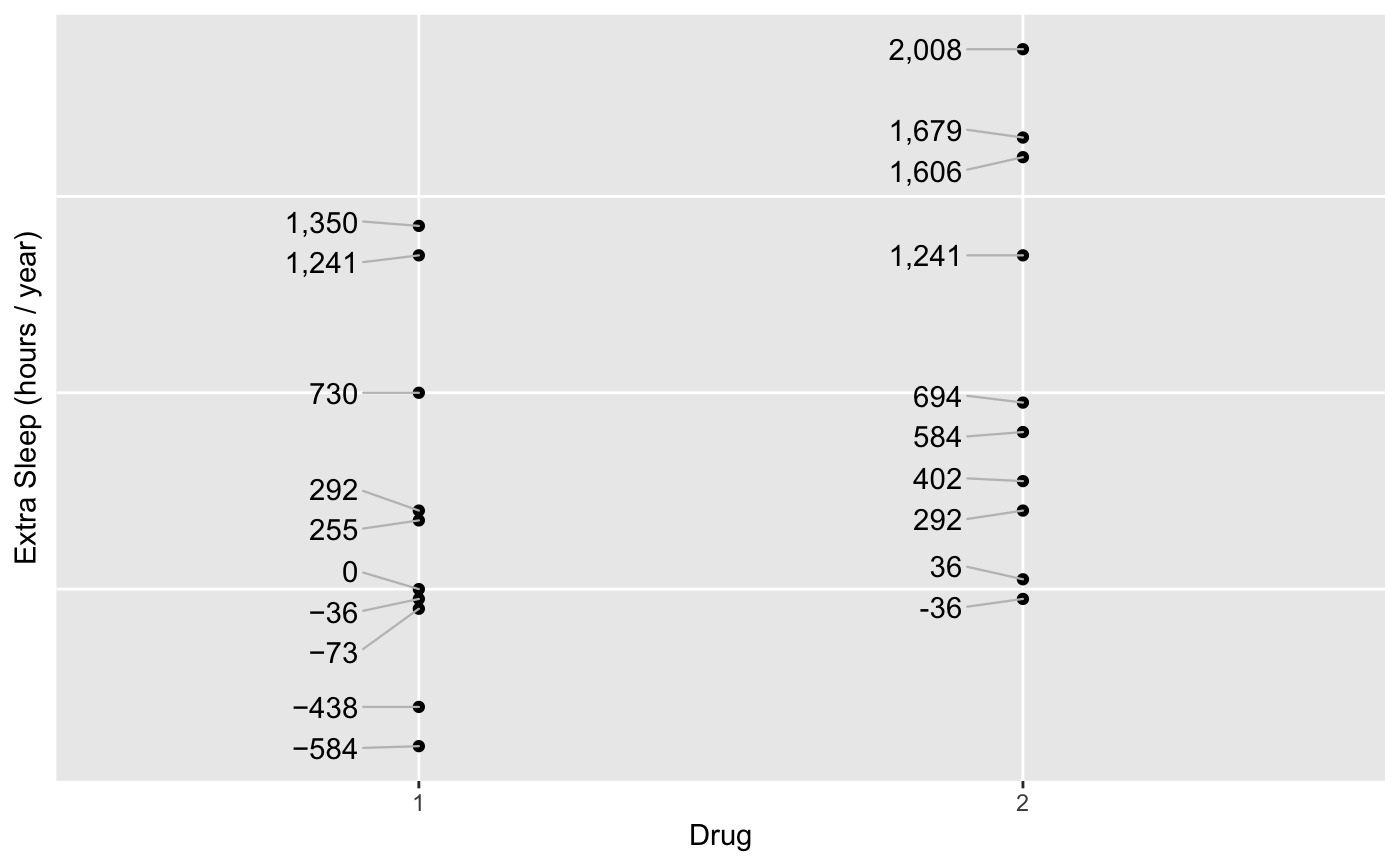
Or we can muliply by days in a year and use scales::comma().
p +
  ylab("Extra Sleep (hours / year)") +
  label_hours(
    aes(
      label = case_when(
        group == 1 ~ signs(extra * 365, format = scales::comma),
        group == 2 ~ comma(extra * 365)
      )
    )
  )
format can be any function that takes a numeric vector and returns a character vector.
Matching by Position
Note that format and all other options (see below) come after the dots; this way you can enjoy the same matching by position you know from scales. For example, if you prefer the simplicity of number(x, 1), you can simply use signs(x, 1).
Other Arguments
signs::signs() offers 3 other arguments for convenience:
add_plussestrim_leading_zeroslabel_at_zero
(#3 is addressed below under Axis Labels.)
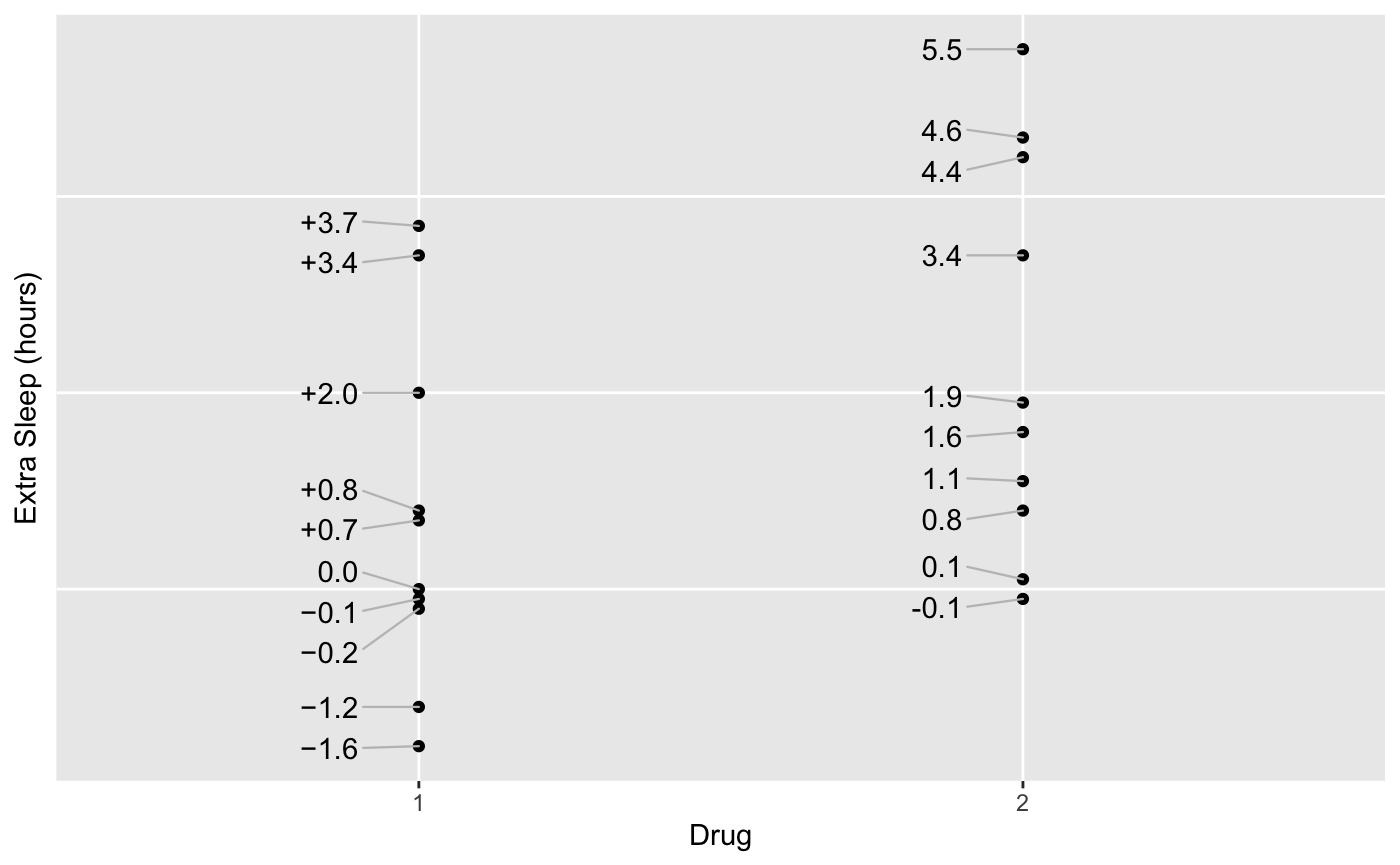
Sometimes, as with this dataset, you want to show change from a baseline. You might not only want to include a − in front of negative numbers, but a + in front of positive numbers as well. This is as simple as add_plusses = TRUE.
p +
  label_hours(
    aes(
      label = case_when(
        group == 1 ~ signs(extra, accuracy = .1, add_plusses = TRUE),
        group == 2 ~ number(extra, accuracy = .1)
      )
    )
  )
If all values are on the interval (−1, 1), it can be more compact to remove leading zeros. Do this with trim_leading_zeros = TRUE:
p +
  ylim(-.8, .8) +
  label_hours(
    aes(
      label = case_when(
        group == 1 ~ signs(extra, accuracy = .1, trim_leading_zeros = TRUE),
        group == 2 ~ number(extra, accuracy = .1)
      )
    )
  ) +
  theme(
    axis.text.y = element_blank(),
    axis.ticks.y = element_blank()
  )
#> Warning: Removed 12 rows containing missing values (geom_point).
#> Warning: Removed 12 rows containing missing values (geom_text_repel).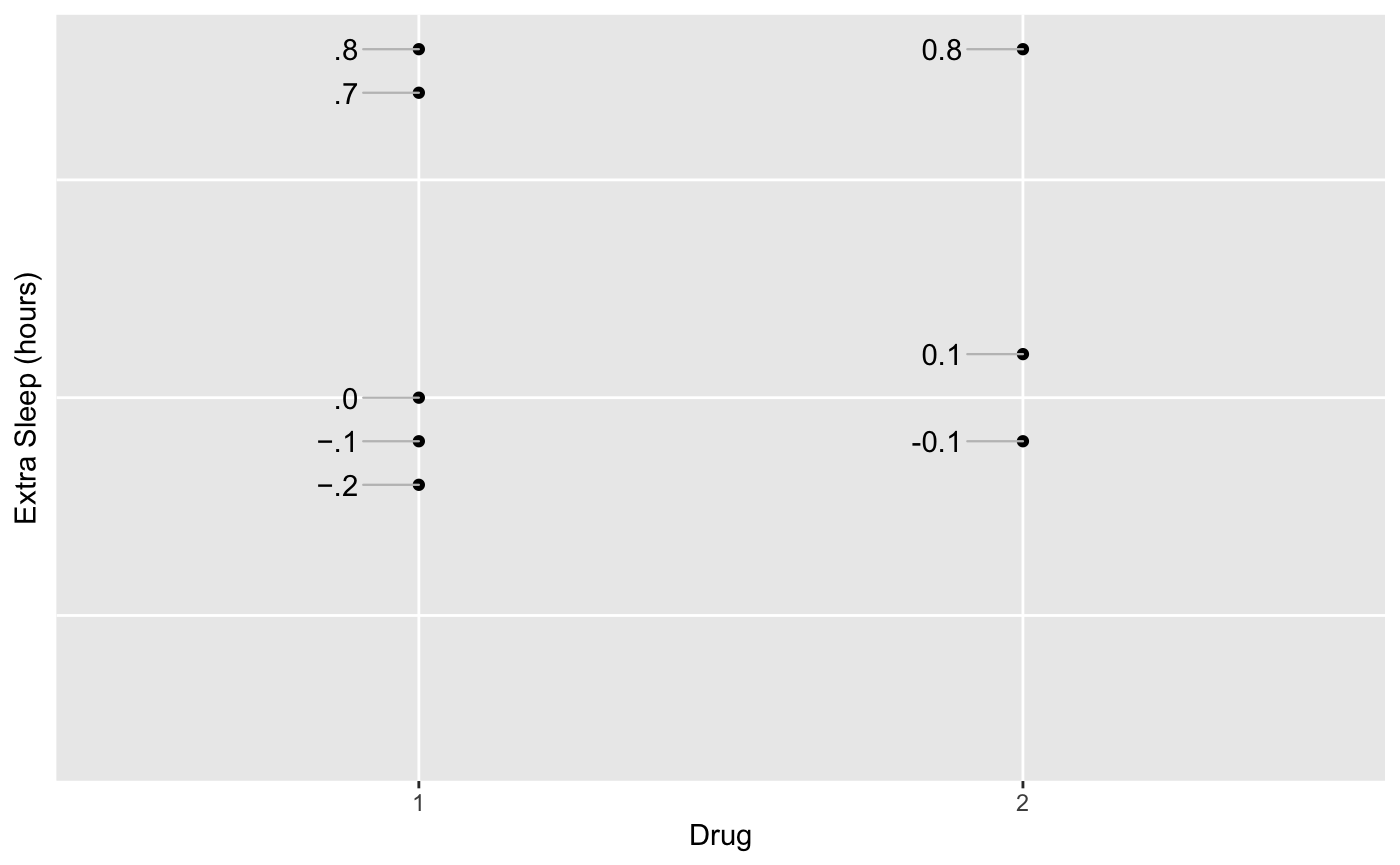
Axis Labels
You can also use Unicode minus signs on an entire axis. This function is called signs::signs_format(), by analogy to scales::number_format(), scales::percent_format(), and the rest of the _format() functions. Note that it accepts the same optional arguments as signs::signs() as well.
theme_update(
  axis.text.y = element_text(hjust = 1)
)

p +
  scale_y_continuous(
    limits = c(-.8, .8),
    breaks = seq(-.8, .8, by = .2),
    labels = signs_format(
      accuracy           = .1,
      add_plusses        = TRUE,
      trim_leading_zeros = TRUE
    )
  ) +
  label_hours(
    aes(
      label = case_when(
        group == 1 ~ signs(
          extra,
          accuracy           = .1,
          add_plusses        = TRUE,
          trim_leading_zeros = TRUE
        ),
        group == 2 ~ number(extra, accuracy = .1)
      )
    )
  )
#> Warning: Removed 12 rows containing missing values (geom_point).
#> Warning: Removed 12 rows containing missing values (geom_text_repel).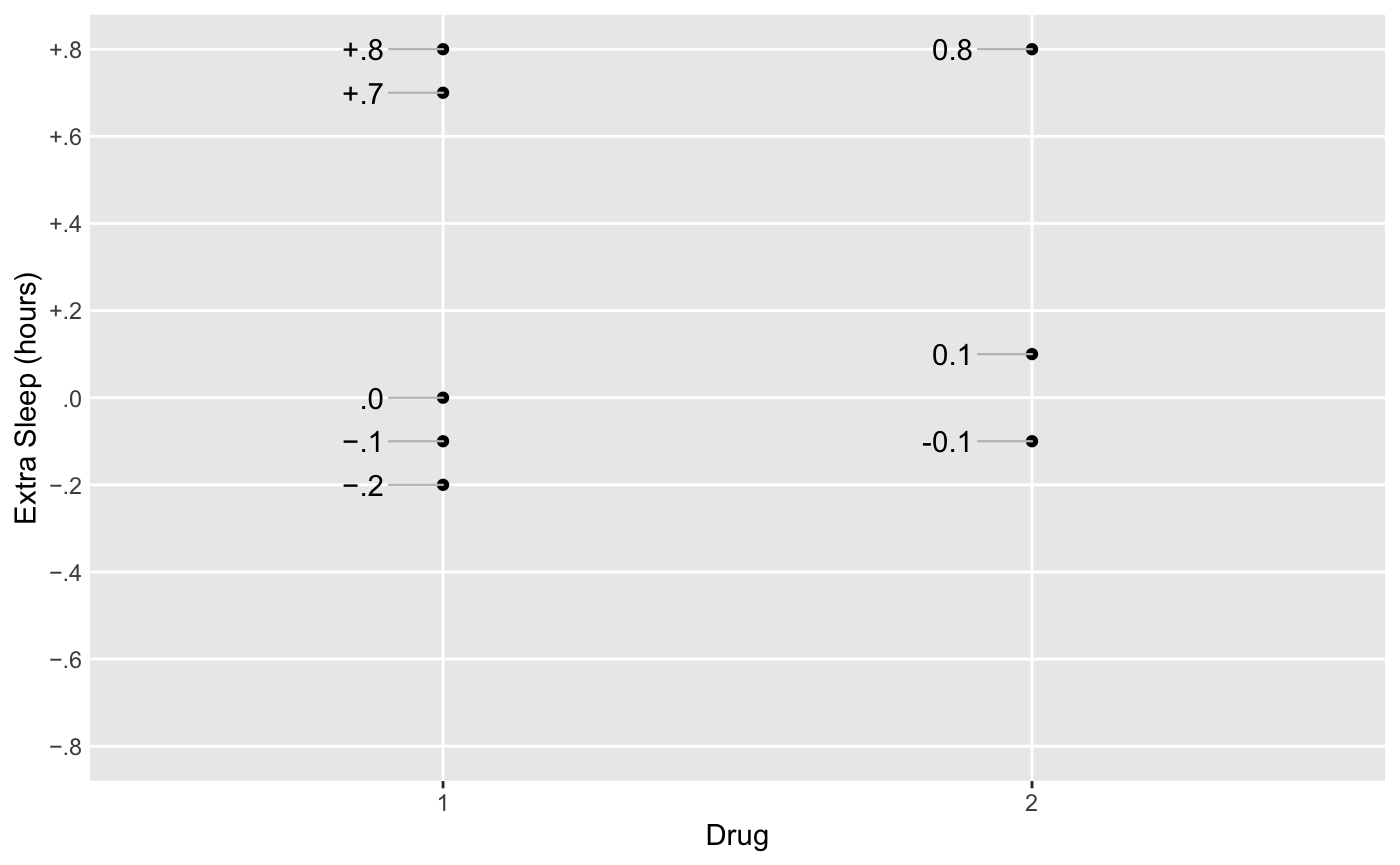
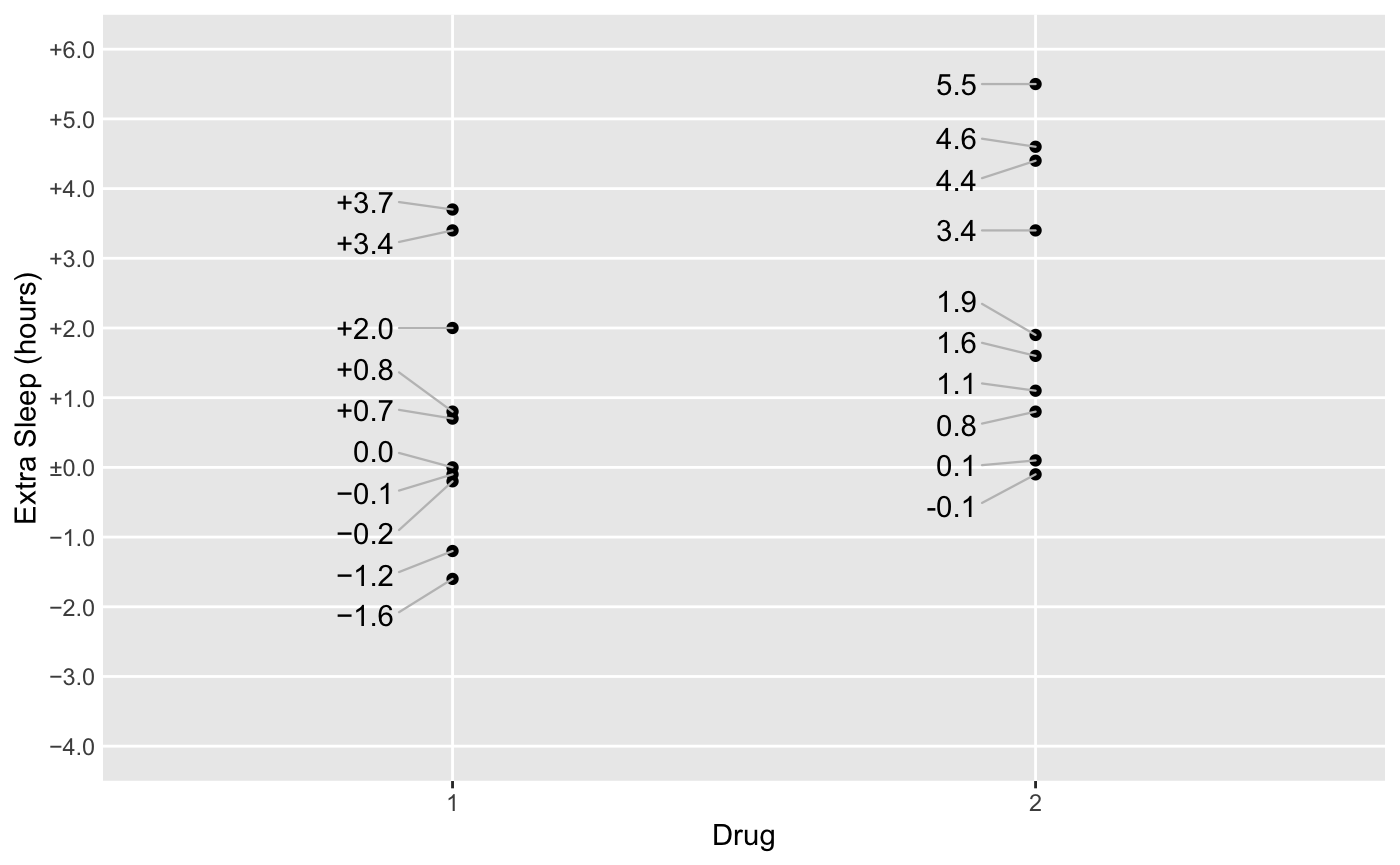
You may want to treat zero itself differently, particularly when every other value has either a plus or a minus. Maybe you’ll be extra pedantic about it with label_at_zero = "symbol" (notice the y-axis labels below, not the data point labels):
p +
  scale_y_continuous(
    limits = c(-4, 6),
    breaks = seq(-4, 6, by = 1),
    labels = signs_format(
      add_plusses = TRUE,
      label_at_zero = "symbol"
    )
  ) +
  label_hours(
    aes(
      label = case_when(
        group == 1 ~ signs(
          extra,
          accuracy = .1,
          add_plusses = TRUE
        ),
        group == 2 ~ number(extra, accuracy = .1)
      )
    )
  )
Or, especially if the location of zero is already obvious, you might want to leave it blank with label_at_zero = "blank":
p +
  scale_y_continuous(
    limits = c(-4, 6),
    breaks = seq(-4, 6, by = 1),
    labels = signs_format(
      add_plusses = TRUE,
      label_at_zero = "blank"
    )
  ) +
  label_hours(
    aes(
      label = case_when(
        group == 1 ~ signs(
          extra,
          accuracy = .1,
          add_plusses = TRUE
        ),
        group == 2 ~ number(extra, accuracy = .1)
      )
    )
)![]()
Setting Options Globally
You can set format, add_plusses, trim_leading_zeros, or label_at_zero globally for a script with options():
options(
  signs.format             = scales::number,
  signs.add.plusses        = TRUE,
  signs.trim.leading.zeros = TRUE,
  signs.label.at.zero      = "none"
)

p +
  scale_y_continuous(
    limits = c(-.8, .8),
    breaks = seq(-.8, .8, by = .2),
    labels = signs_format(accuracy = .1, label_at_zero = "blank")
  ) +
  label_hours(
    aes(
      label = case_when(
        group == 1 ~ signs(extra, accuracy = .1),
        group == 2 ~ number(extra, accuracy = .1)
      )
    )
  )
#> Warning: Removed 12 rows containing missing values (geom_point).
#> Warning: Removed 12 rows containing missing values (geom_text_repel).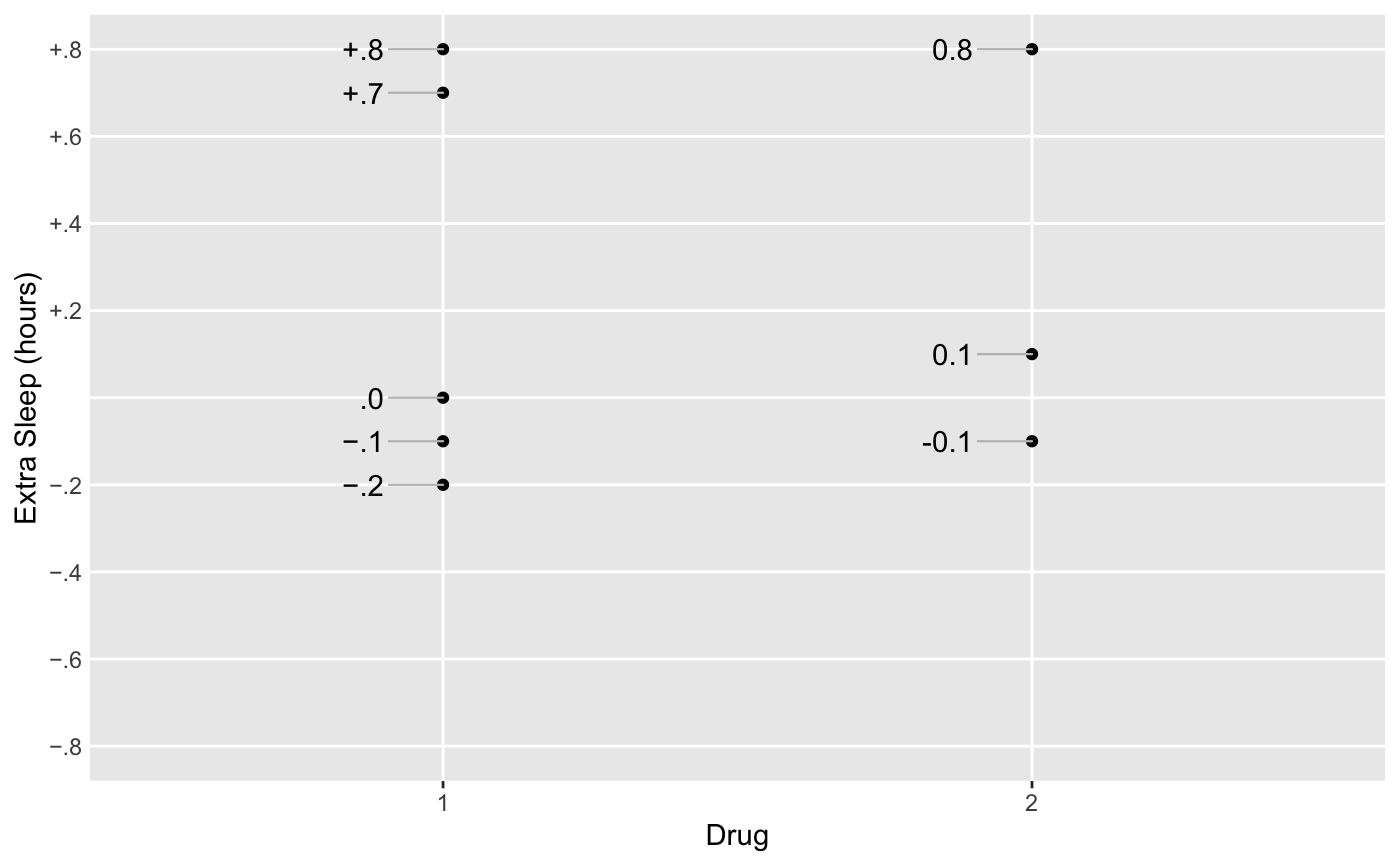
The defaults are scales::number, FALSE, FALSE, and "none", respectively.